Lambda's Managed Kubernetes auto-remediation system#
Lambda's Managed Kubernetes (MK8s) features an auto-remediation system that continuously monitors the health of the nodes in your cluster and automatically initiates a multi-phase remediation process if a node has become unhealthy. This document outlines the system's components and remediation process, and explains how to monitor or inspect remediation processes running on your cluster.
Concepts#
Remediation controllers#
The auto-remediation system consists of two Lambda-managed Kubernetes controllers that run as part of the MK8s control plane. Each controller handles a different set of responsibilities:
-
Controller 1 monitors nodes for GPU health issues. When it detects an unhealthy node, it opens a new incident for that node, waits for the node's workloads to drain, and then creates a custom Remediation resource that defines the action to take. As controller 2 executes that action, controller 1 monitors the progress and result, and escalates if the node does not recover.
-
Controller 2 watches for Remediations and executes the requested action. It polls until the action completes and then reports the result on the Remediation.
Behind the scenes, the system tracks the in-progress remediation work for each new node issue as an incident. The system logs status updates to this incident throughout the remediation process, creating a record of the issue and the steps that were taken to resolve it.
Note
For a more detailed breakdown of the role each controller plays in the remediation lifecycle, see the Remediation lifecycle section.
Remediation#
Controller 1 communicates the next remediation action to take, as well as the current status of that action, by creating a new Remediation. Each Remediation name follows the same template:
By default, the system deletes completed Remediations after 30 days. This retention period can be increased or decreased upon request.
Note
For guidance on how to to view the status of your active remediation processes by inspecting Remediations, see the Working with remediations section.
Remediation lifecycle#
Phase 1: Detection#
Controller 1 monitors for nodes that have been cordoned (marked unschedulable)
and are reporting an unhealthy condition—for example, GpuNvlink or GpuXid.
When the controller detects a node that satisfies these criteria, it opens a
new incident for that node.
Phase 2: Drain period#
To prevent data loss, controller 1 then initiates a drain period and waits
for workloads to drain from the node. To indicate that the mode is currently
draining, the controller adds a
remediation.k8s.lambda.ai/pending-drain label to the node at the beginning
of the drain period. When the controller detects that the draining process has
completed, it removes this label and moves on to the next phase.
Phase 3: Remediation action#
Each unhealthy node condition maps to a recommended repair action. After the node's workloads have been drained, controller 1 uses this mapping to determine the action to recommend, then creates a Remediation for the action. Controller 2 then processes this Remediation and performs the action.
Possible actions:
| Action | Description |
|---|---|
power-cycle |
Reboots the node. |
flea-drain |
Performs a hardware-level power reset to clear issues that persist across reboots. |
escalate |
Escalates to manual intervention by Lambda operations. |
Phase 4: Escalation#
Each time an action fails to recover the node, the system automatically escalates to the next action and creates a new Remediation for controller 2 to execute. The escalation sequence is ordered from least disruptive action to most disruptive action:
power-cycle → flea-drain → escalate
Phase 5: Resolution#
- Success: The node becomes
Readyand is uncordoned. The system closes the incident. - Escalation: The system places the node in maintenance and routes it to Lambda operations for hardware troubleshooting.
- Unresolved: All automated steps are exhausted and the issue requires manual investigation.
Working with remediations#
Inspecting Remediations#
You can inspect active Remediations in your cluster with kubectl:
# List all Remediations
kubectl get rem

# Watch Remediations in real time
kubectl get rem -w

# Filter by node
kubectl get rem --field-selector=spec.nodeName=gpu-node-01

# View full details
kubectl describe rem <REMEDIATION-NAME>
Each Remediation contains the following status fields:
| Column | Meaning |
|---|---|
Valid |
True indicates the remediation passed validation. |
Executed |
True indicates the action completed successfully. |
NodeReady |
True indicates the node recovered. |
Processed |
True indicates the remediation reached a terminal state. |
A successful Remediation progresses through validation, execution, and recovery.
Viewing remediation events#
The system emits Kubernetes events during remediation. You can view these events
with kubectl:
| Event | Type | Description |
|---|---|---|
RemediationCreated |
Normal |
A Remediation was created |
RemediationStarted |
Normal |
The remediation action started |
RemediationSucceeded |
Normal |
The node recovered |
RemediationFailed |
Warning |
The action failed or did not recover the node |
NodePendingDrain |
Normal |
The system is waiting for workloads to drain |
DrainCheckSkipped |
Normal |
Drain checks were bypassed |
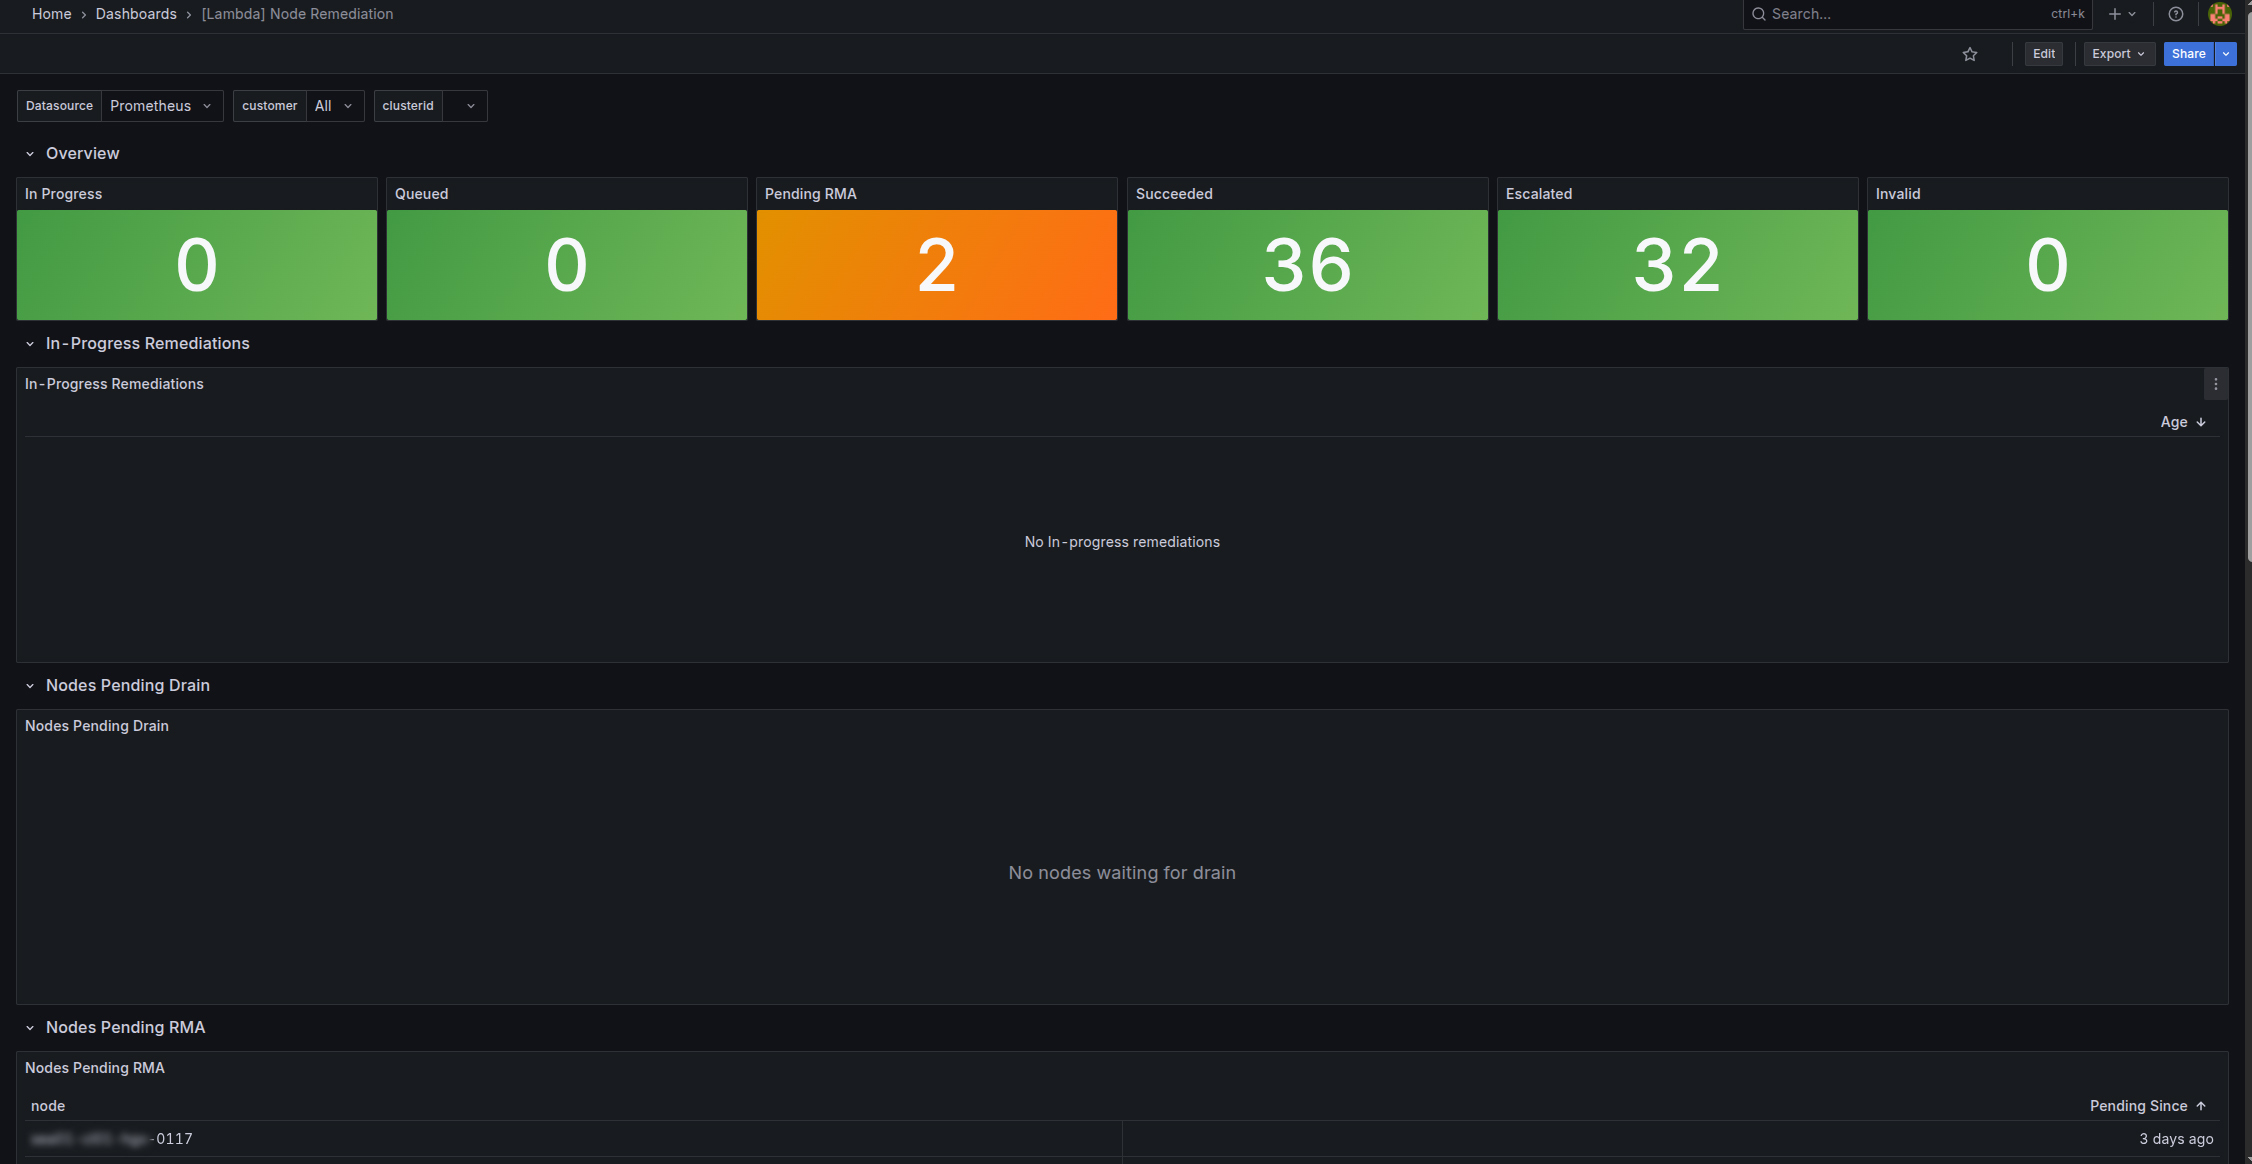
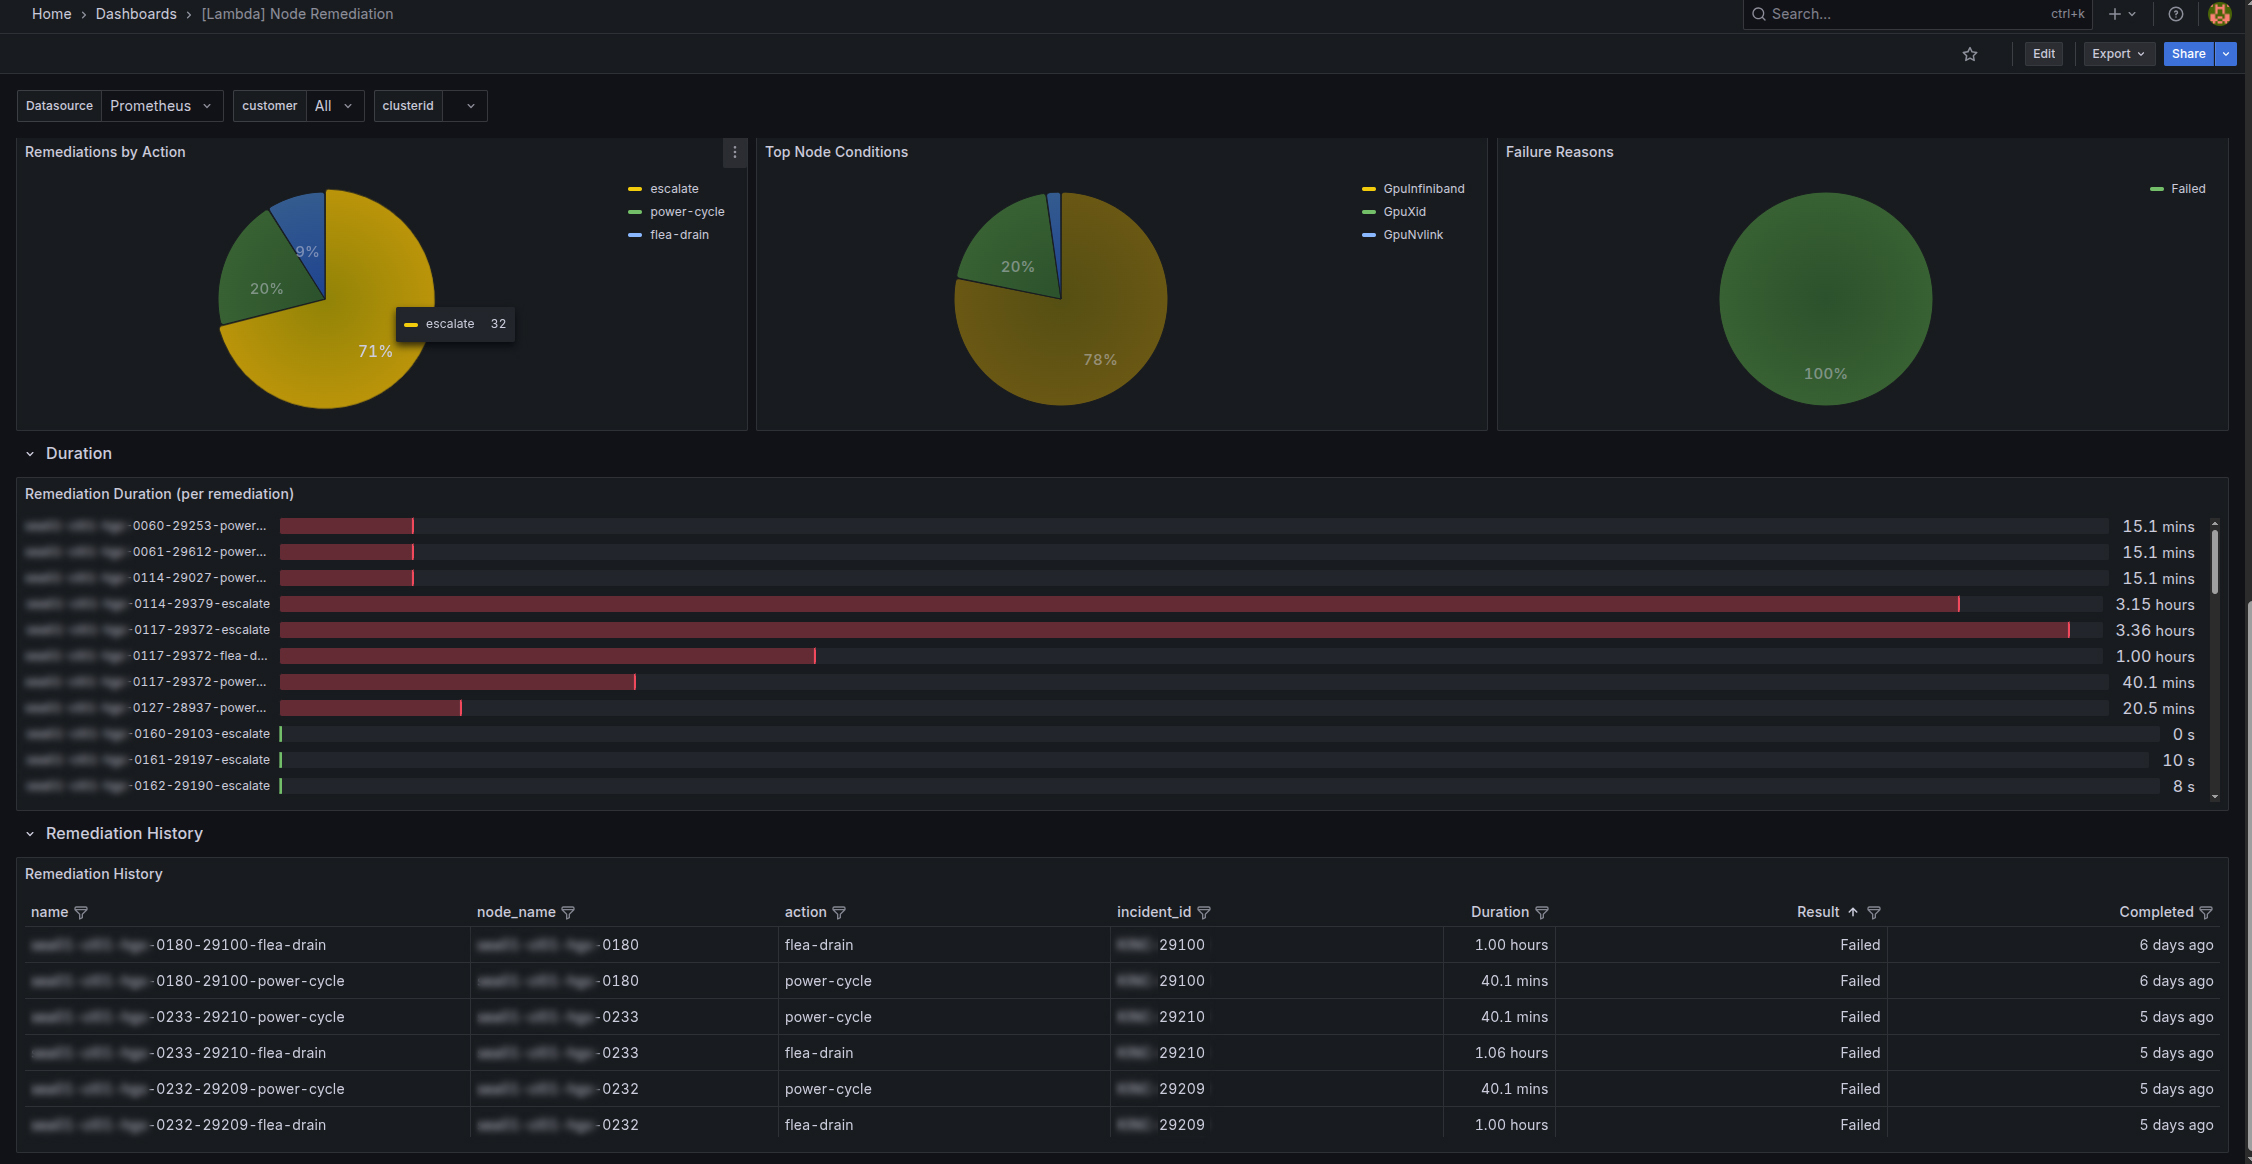
Monitoring remediation activity in Grafana#
You can also view remediation activity by visiting the MK8s Grafana dashboards. To access the remediation dashboard:
-
Navigate to
https://grafana.<CLUSTER-ZONE>.k8s.lambda.ai, replacing<CLUSTER-ZONE>with the cluster zone your MK8s cluster resides in. -
At the login prompt, click Sign in with lambda.
-
In the left nav, select Dashboards.
-
Select [Lambda] Node Remediation.
The remediation dashboard includes in-progress remediations and remediation history.